One of the projects I’ve been working on a lot lately is deciding on a content delivery network to use for delivering images and files on clients’ website. I wanted a CDN that could deliver images and video relatively quickly throughout the United States as that is where most of my clients are located. A CDN can speed up page load times considerably and make a big difference for end-user experience.
The content providers I tested are:
Cloudflare – Lowest tier is $10/month
BunnyCDN – Prepaid, no monthly minimum
StackPath – $10/month on a legacy plan that is now discontinued.
Cloudinary – Free tier (They have a pretty good free tier in my opinion)
Overall, I would say performance across the three was pretty good. The testing I’ve done on them seems to be in line with the data I’ll be showing in this post. Obviously, this could change at any time as content delivery networks are constantly changing and developing. Over the past few months I’ve collected data and consistently seen just about the same results as I show here.
Cloudflare Images is a new service that was just released publicly over the past couple of weeks so I’m sure that the data will change for them as they optimize the edge network as Cloudflare seems to always be doing.
Testing methodology:
I uploaded the same image to all three CDNs. For this blog post I used the Uptrends CDN test tool –https://www.uptrends.com/tools/cdn-performance-check to get the data seen below. I ran the test three times, the first time to get the initial pull (image should be uncached across the CDN), the second time to ensure it was in the cache, and the third to get the cached result.
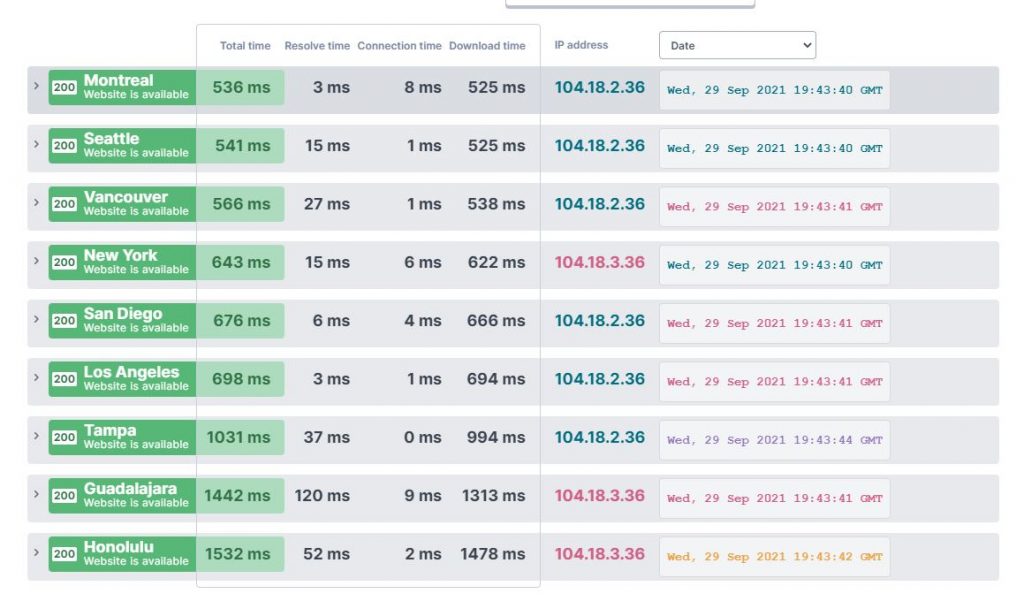
Initial Pulls:
Cloudflare Initial
Stackpath Initial
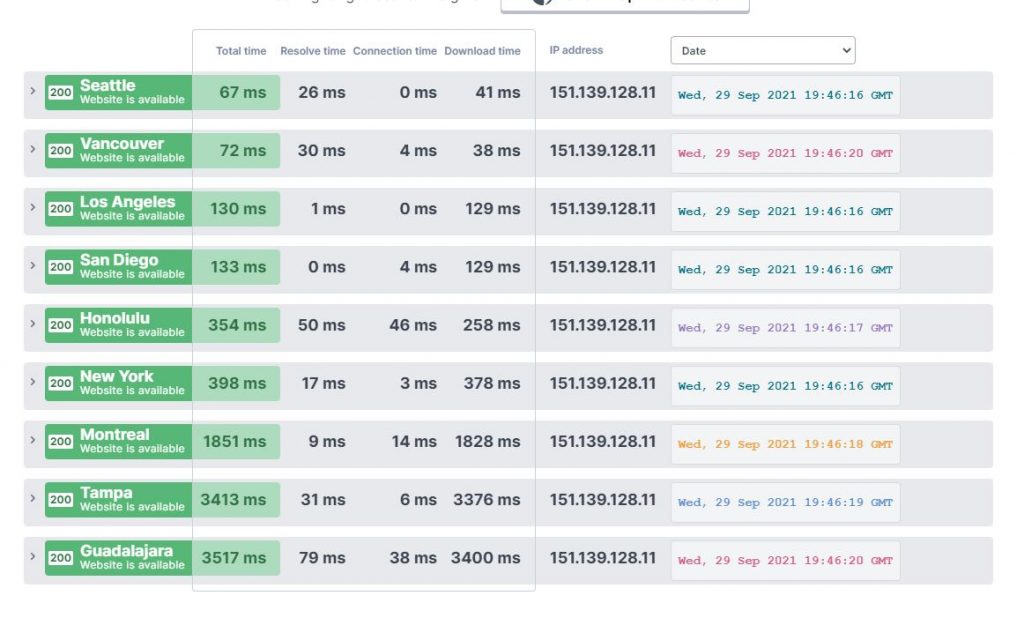
BunnyCDN Initial
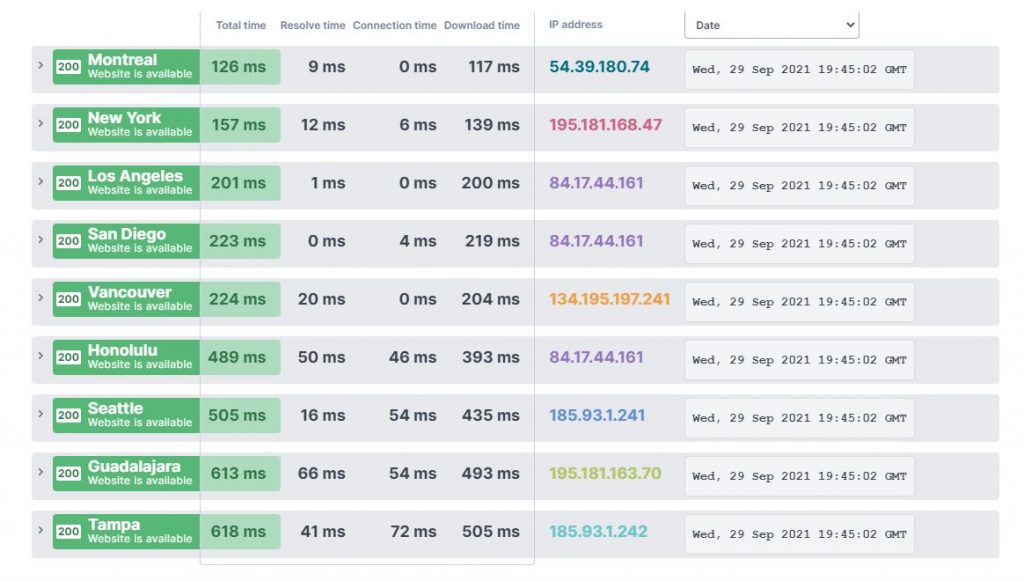
Cloudinary Initial
An interesting result here, BunnyCDN seems to do the best with time between pulling from the origin and delivering to the client.
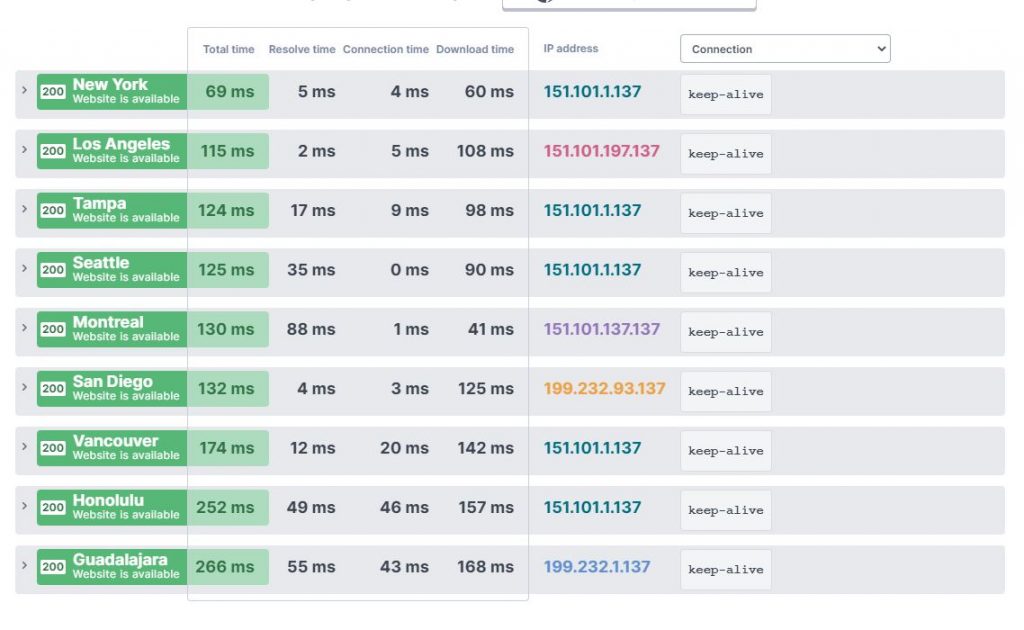
Let’s see how they do once they’ve cached the file on the edge nodes:
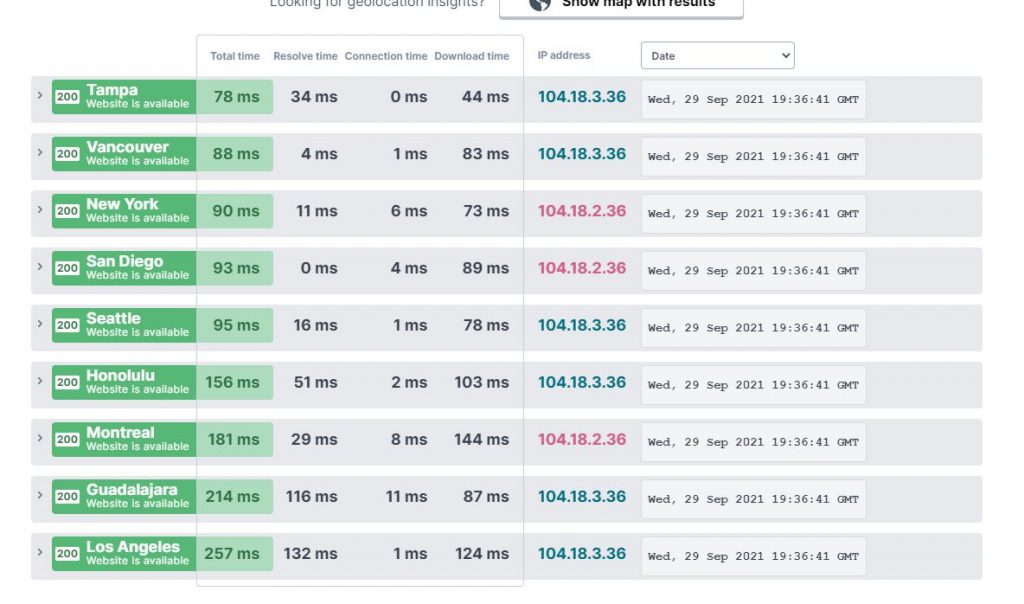
Cloudflare
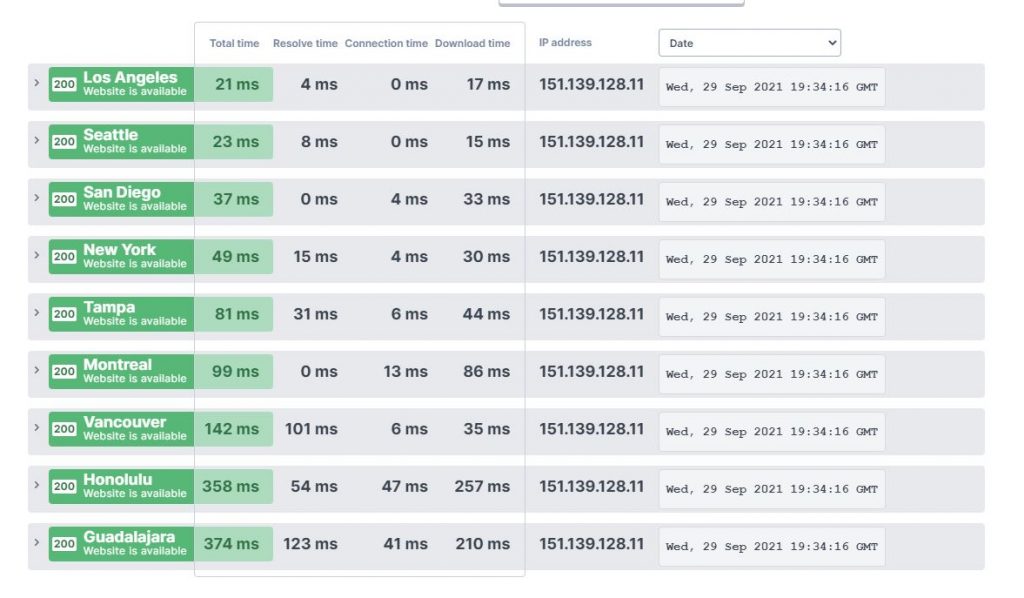
StackPath
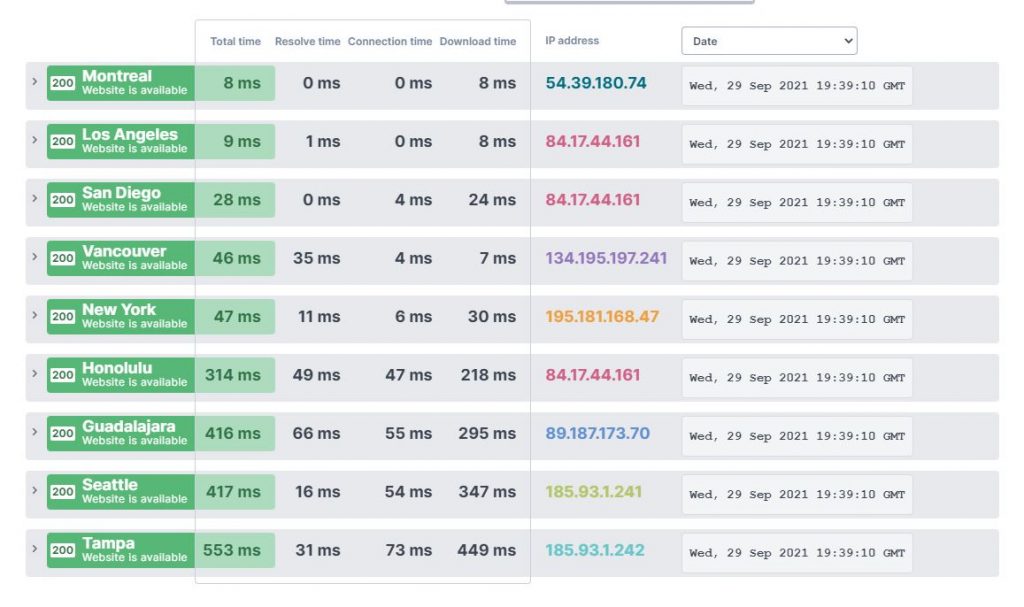
BunnyCDN
Cloudinary
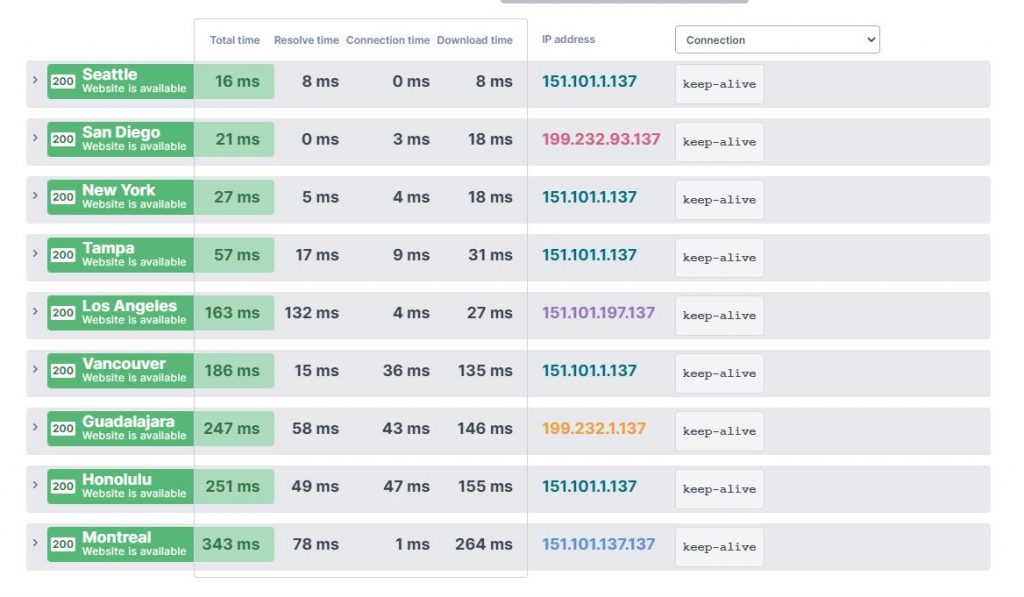
The cached data is pretty interesting to me.
| Location | BunnyCDN | Stackpath | Cloudflare | Cloudinary |
| Guadalajara | 416 | 374 | 214 | 247 |
| Honolulu | 314 | 358 | 156 | 251 |
| Los Angeles | 9 | 21 | 257 | 163 |
| Montreal | 8 | 99 | 181 | 343 |
| New York | 47 | 49 | 90 | 27 |
| San Diego | 28 | 37 | 93 | 21 |
| Seattle | 417 | 23 | 95 | 16 |
| Tampa | 553 | 81 | 78 | 57 |
| Vancouver | 46 | 142 | 88 | 186 |
| Average | 204.2222222 | 131.5555556 | 139.1111111 | 145.6666667 |
Looking at the average times may not be the best way to understand what’s going on here, but it does help to indicate how images loaded from each CDN might affect page load times. Overall they seem to be pretty much in line with each other, with the exception of BunnyCDN having some fairly high load times in metropolitan areas where I’ve not seen that be the case before. My data does seem to line up pretty well with what I’ve seen from multiple sources.
Summary:
Overall the three CDNs performed well. I wouldn’t hesitate to use any of them on a project as they would likely be better than just dropping in the images to the website and having them deliver across the world from a web server that could be pretty far from your client.
Keep an eye on this blog, in the future we will be creating our own CDN to learn more about GeoIP routing, Anycast DNS, and content caching. I look forward to sharing the write-up on this upcoming project.